 |
|---|
 |
|---|
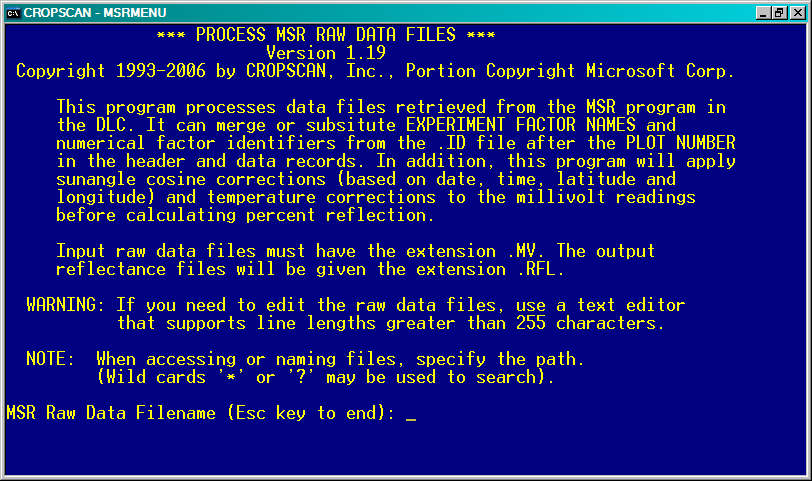
| Example file name: mydata.mv |
|---|
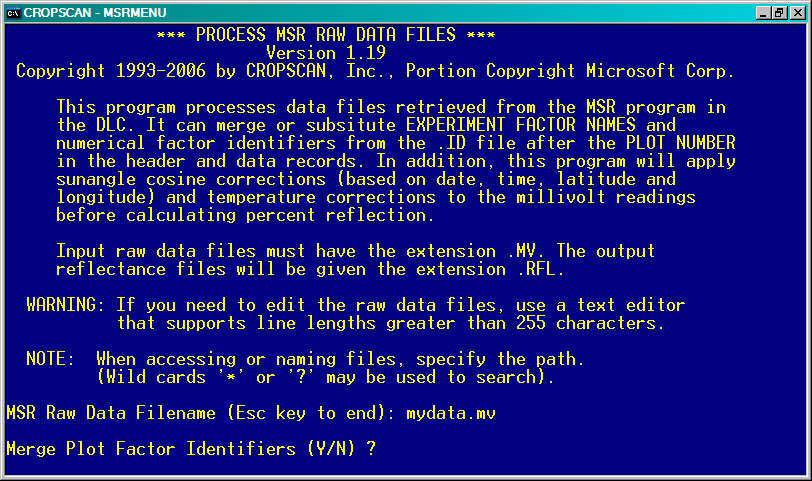 |
The POSTPROC program supports merging plot experimental factor identifiers into the output reflectance file. This can help subsequent statistical analysis by having the factor identifiers in the same file as the reflectance data. Merging plot factors is optional. Mergeable plot factor files can be created using the FACTORID program. Refer to the MSR User's Manual and program help text for additional information. For this example, merging plot factors will not be done.
 |
|---|
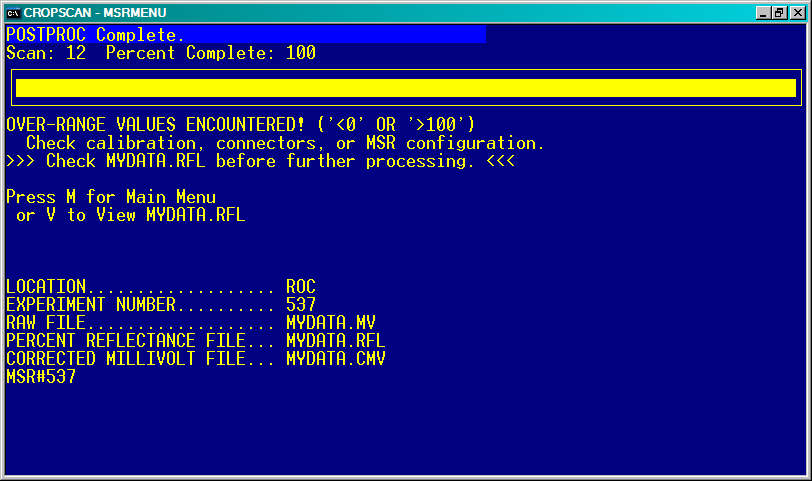
A progress bar is display to display the progression of processing. Being a data calculation intensive program, large MSR data files can cause POSTPROC to take several seconds to process, depending on the PC CPU speed.
Any error condition detected will result in a message display, such as the over-range value message displayed above.
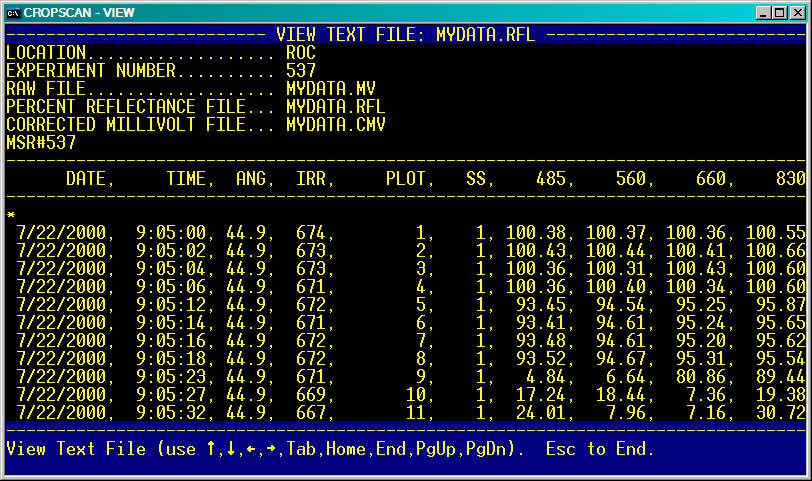 |
|---|
The navigational keys shown can be used to scroll up and down or left and right to view the entire output reflectance file.
LOCATION................... ROC
EXPERIMENT NUMBER.......... 537
RAW FILE................... MYDATA.MV
PERCENT REFLECTANCE FILE... MYDATA.RFL
CORRECTED MILLIVOLT FILE... MYDATA.CMV
MSR#537
----------------------------------------------------------------------------------------
      DATE,     TIME,  ANG,  IRR,     PLOT,   SS,    485,    560,    660,    830,   1650
----------------------------------------------------------------------------------------
*
 7/22/2000,  9:05:00, 44.9,  674,        1,    1, 100.38, 100.37, 100.36, 100.55, 100.36
 7/22/2000,  9:05:02, 44.9,  673,        2,    1, 100.43, 100.44, 100.41, 100.66, 100.38
 7/22/2000,  9:05:04, 44.9,  673,        3,    1, 100.36, 100.31, 100.43, 100.60, 100.28
 7/22/2000,  9:05:06, 44.9,  671,        4,    1, 100.36, 100.40, 100.34, 100.60, 100.22
 7/22/2000,  9:05:12, 44.9,  672,        5,    1,  93.45,  94.54,  95.25,  95.87,  92.69
 7/22/2000,  9:05:14, 44.9,  671,        6,    1,  93.41,  94.61,  95.24,  95.65,  92.48
 7/22/2000,  9:05:16, 44.9,  672,        7,    1,  93.48,  94.61,  95.20,  95.62,  92.48
 7/22/2000,  9:05:18, 44.9,  672,        8,    1,  93.52,  94.67,  95.31,  95.54,  92.39
 7/22/2000,  9:05:23, 44.9,  671,        9,    1,   4.84,   6.64,  80.86,  89.44,  72.74
 7/22/2000,  9:05:27, 44.9,  669,       10,    1,  17.24,  18.44,   7.36,  19.38,  74.59
 7/22/2000,  9:05:32, 44.9,  667,       11,    1,  24.01,   7.96,   7.16,  30.72,  55.13
 7/22/2000,  9:05:37, 44.9,  665,       12,    1,  10.54,  11.20,  12.21,  15.75,  18.92
END
|
The values displayed under the radiometer center-wavelength headers are the percent reflectance values.
 CROPSCAN, Inc. Home Page